
Don't Blame Me...For Collecting Taylor Swift Song Data
Whether or not a fan of hers, Taylor Swift's music is heard and loved everywhere. This post shows how to collect data about Taylor Swift songs from different sources.
Introduction
Taylor Swift’s music has been influential since the beginning of her career. At just 16 years old, she had a song in the Billboard Top 100 – an accomplishment that many artists never reach in their entire career. Nearly two decades later, her music still makes an impact, whether it be the release of her lastest album Midnights or the record breaking sales of the Eras Tour.
People love Swift’s music for many reason including her lyricism, music variety, unique production, or a combination of all of these. While Swift has accomplished many things over the years, I have been curious to see what exactly makes her music so popular.

Why Do Songs Get Popular
Because Taylor Swift’s music is so influential, both to listeners and other artists, I want to determine what aspects of her most popular songs have actually made them so popular. While it is true that Swift’s reputation in the music industry has played a role in her continued success, it is also important to note that trends among her own songs may be indicators for what makes songs from her own work stand out more from others.
What Does the Data Say?
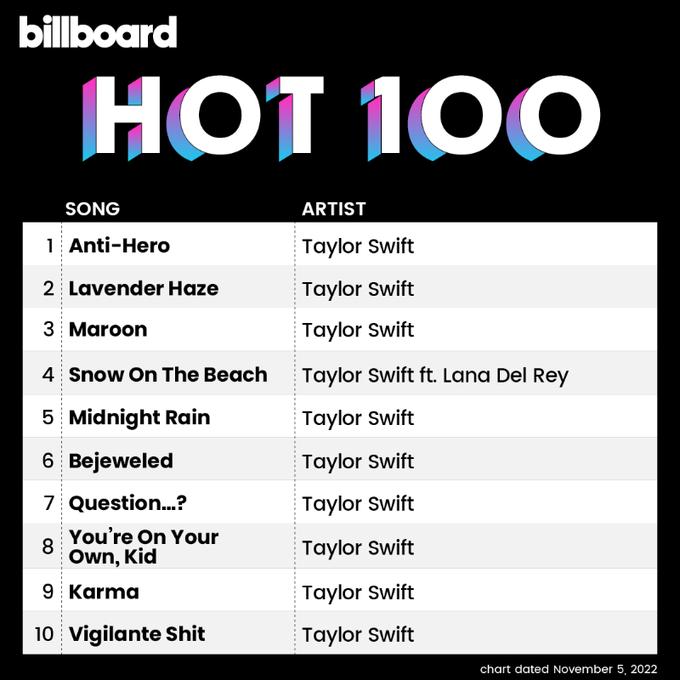
For this project, I use three datasets to look into Taylor Swift’s song popularity. A dataset corresponding to song characteristics and popularity was available for use on Kaggle. A free access dataset from data.world contains all of Swift’s songs and their lyrics. The last dataset used was available on Billboard Top 100 which gives information on Swift’s song’s appearances on this chart.
Complete code and data can be found in this GitHub Repo.
Data Collection
Tools
I used Python, Requests, and BeautifulSoup to get this data. Because I web-scraped the Billboard Top 100 songs page, I used the Requests package to ensure that the data I collected was available to use.
Billboard Top 100 Data Web-Scraping
BeautifulSoup Prep
-
Import the necessary packages with the following code:
from bs4 import BeautifulSoup import requests import lxml import pandas as pd import regex -
To access the website from Python, we will first copy the URL and save it as a varible.
url = 'https://www.billboard.com/artist/taylor-swift/chart-history/hsi/' -
Using requests, get the contents from the URL. Following this, use BeautifulSoup to read the page elements and save them into a variable. The
doc.prettify()function allows you to read through the contents of the page easier.r = requests.get(url) doc = BeautifulSoup(r.content, 'lxml') structured_doc = doc.prettify()
Navigating Through Page Elements
- Now that the website information is in the code and parsed, the next step is to find the information for the desired table/information.
The first step to doing this is to inspect the html. In Google Chrome, navigate to the three dots in the top right corner, move to “more tools”, then select “developer tools.” In Safari, right click on the window, and select “inspect elements.” If this option does not appear, try changing Safari preferences on the machine.
For this example, we want to find the “div” element with “class = o-chart-results-list-row // lrv-u-flex lrv-u-flex-direction-column@mobile-max u-height-100 lrv-u-background-color-white”. To get the data on Taylor Swift’s Billboard top songs, we will look through this element of the page, so save this search to a variable.
```ss = doc.findAll('div', class_ = 'o-chart-results-list-row // lrv-u-flex lrv-u-flex-direction-column@mobile-max u-height-100 lrv-u-background-color-white')```
After finding the table element on the page, find the element that corresponds to each song. In this particular data format, each song corresponds to a row. Run the code below to extract the song element.
```song = doc.findAll('div','o-chart-results-list__item // lrv-u-flex lrv-u-flex-direction-column lrv-u-flex-grow-1 lrv-u-justify-content-center lrv-u-border-b-1 u-border-b-0@mobile-max lrv-u-border-color-grey-light lrv-u-padding-lr-2 lrv-u-padding-lr-1@mobile-max lrv-u-padding-tb-050@mobile-max')```

```s1 = doc.find_all('div', class_='o-chart-results-list__item // lrv-u-flex lrv-u-flex-direction-column lrv-u-flex-grow-1 lrv-u-justify-content-center lrv-u-border-b-1 u-border-b-0@mobile-max lrv-u-border-color-grey-light lrv-u-padding-lr-2 lrv-u-padding-lr-1@mobile-max lrv-u-padding-tb-050@mobile-max')```
Cleaning Data
- Inspect the variable s1. There are unwanted tabs, new lines, and spaces in this data. To resolve this, use a series of
replace()functions to target these unwanted parts.
Tip: To do this most effectively, start with the longest unwanted string of characters and move down. The code below demonstrates this.
```song_name = []
for i in s1:
    song_name.append(i.text.strip())
s2 = []
for g in song_name:
    s2.append(g.replace('\t\t\n\t\n\n\n\t\n\tTaylor Swift',''))```
s3 = []
for g in s2:
    s3.append(g.replace('\t\t\n\t\n\n\n\t\n\tBig Red Machine Featuring Taylor Swift',''))

s4 = []
for g in s3:
    s4.append(g.replace('\t\t\n\t\n\n\n\t\n\tSugarland Featuring Taylor Swift',''))

s5 = []
for g in s4:
    s5.append(g.replace('\t\t\n\t\n\n\n\t\n\tEd Sheeran Featuring Taylor Swift',''))

s6 = []
for g in s5:
    s6.append(g.replace('\t\t\n\t\n\n\n\t\n\tB.o.B Featuring Taylor Swift',''))

s7 = []
for g in s6:
    s7.append(g.replace('\t\t\n\t\n\n\n\t\n\tTim McGraw With Taylor Swift',''))

s8 = []
for g in s7:
    s8.append(g.replace('\t\t\n\t\n\n\n\t\n\tBoys Like Girls Featuring Taylor Swift',''))

s9 = []
for g in s8:
    s9.append(g.replace('\t\t\n\t\n\n\n\t\n\tZayn / Taylor Swift',''))```
We now have the song data cleaned and stored in a variable. The next steps will be a repeat of this process with the other desired table elements.
Other Variables
-
Now, repeat the step of navigating through page element, but with the class that identifies the debut date of a song. The code is the same structure but with different variable names.
dd = doc.find_all('div', class_='o-chart-results-list__item // u-width-143@tablet u-width-67@mobile-max lrv-u-flex lrv-u-align-items-center lrv-u-justify-content-center u-justify-content-flex-end@mobile-max u-flex-grow-1@mobile-max lrv-u-background-color-grey-lightest lrv-u-border-b-1 u-border-b-0@mobile-max lrv-u-border-color-grey-light lrv-u-padding-r-075@mobile-max') debut_date = [] for i in dd: debut_date.append(i.text.strip()) -
Repeat this process but with the peak date element
peakd = doc.find_all('div', class_='o-chart-results-list__item // u-width-143@tablet u-width-82@mobile-max lrv-u-flex lrv-u-align-items-center lrv-u-justify-content-center lrv-u-background-color-grey-lightest lrv-u-border-b-1 u-border-b-0@mobile-max lrv-u-border-color-grey-light') peak_date = [] for i in peakd: peak_date.append(i.text.strip()) -
Repeat with the weeks on the chart element
w = doc.find_all('div', class_='o-chart-results-list__item // u-width-72 u-width-55@mobile-max lrv-u-flex lrv-u-align-items-center lrv-u-justify-content-center u-background-color-white-064@mobile-max lrv-u-border-b-1 u-border-b-0@mobile-max lrv-u-border-color-grey-light') weeks = [] for i in w: weeks.append(i.text.strip()) -
Repeat with the peak position element
peakpos = doc.find_all('div', class_='o-chart-results-list__item // u-width-72 u-width-55@mobile-max lrv-u-flex lrv-u-flex-direction-column lrv-u-align-items-center lrv-u-justify-content-center u-background-color-white-064@mobile-max lrv-u-border-b-1 u-border-b-0@mobile-max lrv-u-border-color-grey-light')
peak_position = []
for i in peakpos:
    peak_position.append(i.text.strip())
After running this code, there are some formatting errors with the weeks. Similar to the process that was used to correctly format the song titles, the code below removes unwanted new lines and tabs.
peak_position2 = []
for g in peak_position:
    peak_position2.append(g[:2])
peak_position3 = []
for g in peak_position2:
peak_position3.append(g.replace(‘\n’,’’))```
Exporting data
- To export the extracted data into a format that is easy to work with, I saved the variables to a dataframe. I then transposed them to a vertical format and gave column names that indicated what the variable was telling.
ts_data = pd.DataFrame([s9,debut_date,peak_date,peak_position3,weeks])
ts_data = ts_data.transpose()
ts_data.columns=['song','debut','peak_date','peak_position','weeks_in_top']
ts_data
- Because I am using this data with other datasets, I saved it to a csv file. The code below shows how to do this.
ts_data.to_csv('ts_billboard_data.csv')
Kaggle and data.world Datasets
The process for reading in the datasets from Kaggle and data.world simply use the pandas package. The code below shows this process (after downloading from the links earlier in this post).
```from bs4 import BeautifulSoup
import requests
import pandas as pd

ts_spotify = pd.read_csv('~/Desktop/STAT386/FinalDataProject/spotify_taylorswift.csv')
ts_lyrics = pd.read_csv('~/Desktop/STAT386/FinalDataProject/taylor_swift_lyrics.csv')```
The csv files for all three datasets can be found at the repository linked earlier in this post.
#Conclusion
In this post, I showed how to access Taylor Swift song data from three different sources. One was web-scraped from Billboard Top 100, one was spotify data from Kaggle, and one was lyric data off of data.world. In my next post, I will explore this data and see if there are trends between song characteristics and popularity.
Please let me know if there are any ideas/recommendations that you have after reading this!